Parametrized Nice Reports with Quarto and PDF
UseR 2024
whoami
Founded a consultancy business
![]()
Also work with R for the Rest of Us
![]()
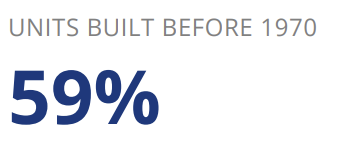
Produced 1000+ parametrized reports
Contact me: thomas@kantiles.com
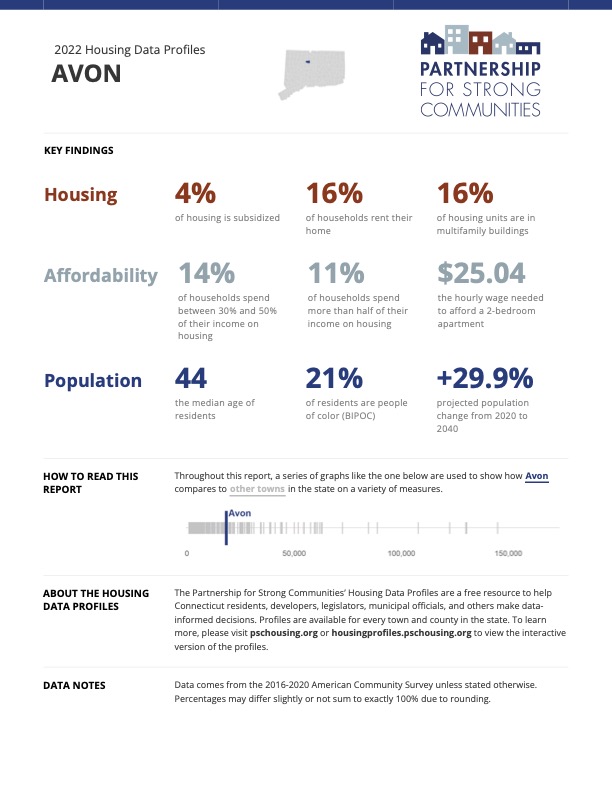
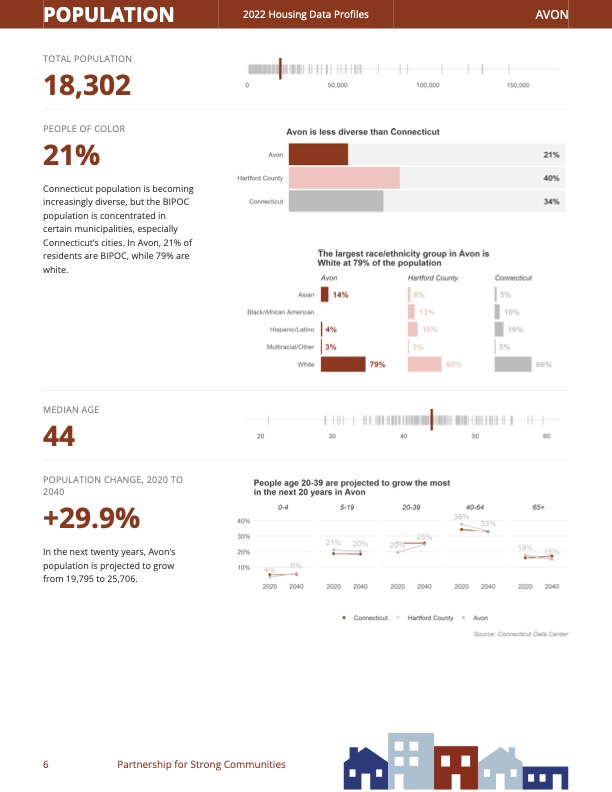
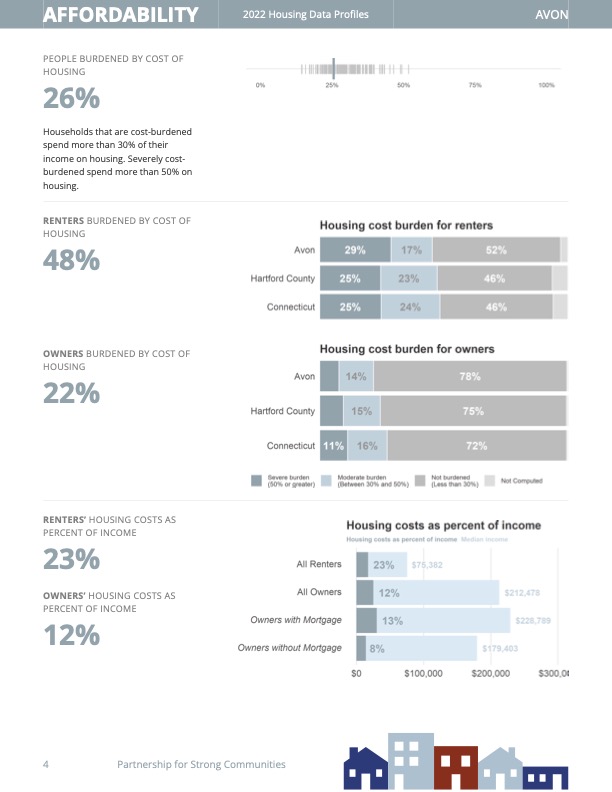
PSC Housing
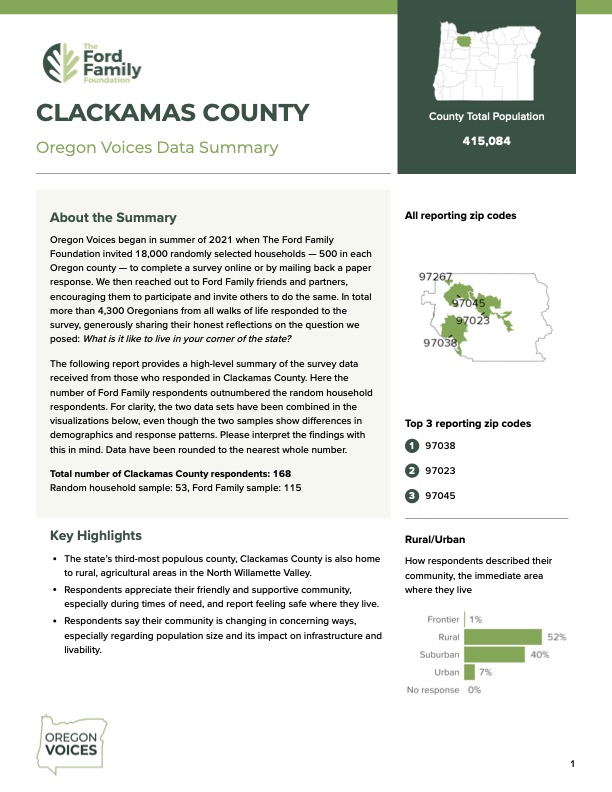
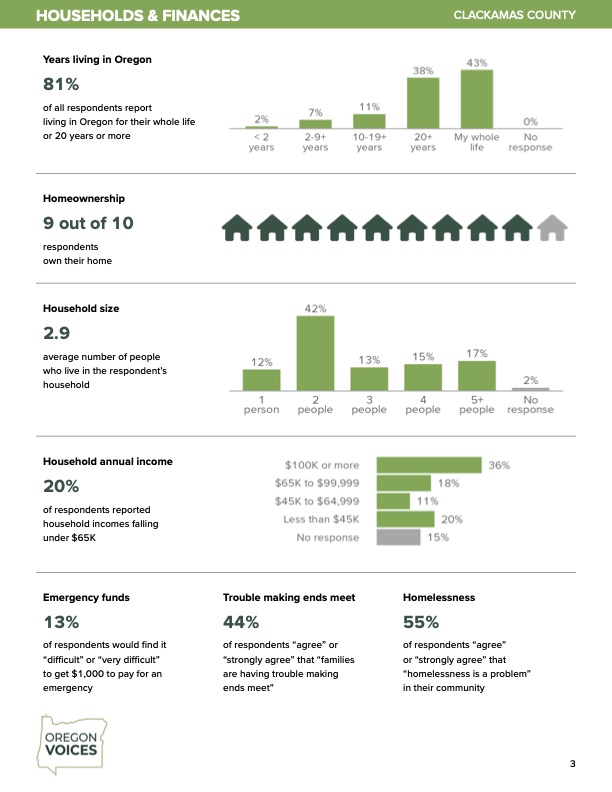
Oregon Voices
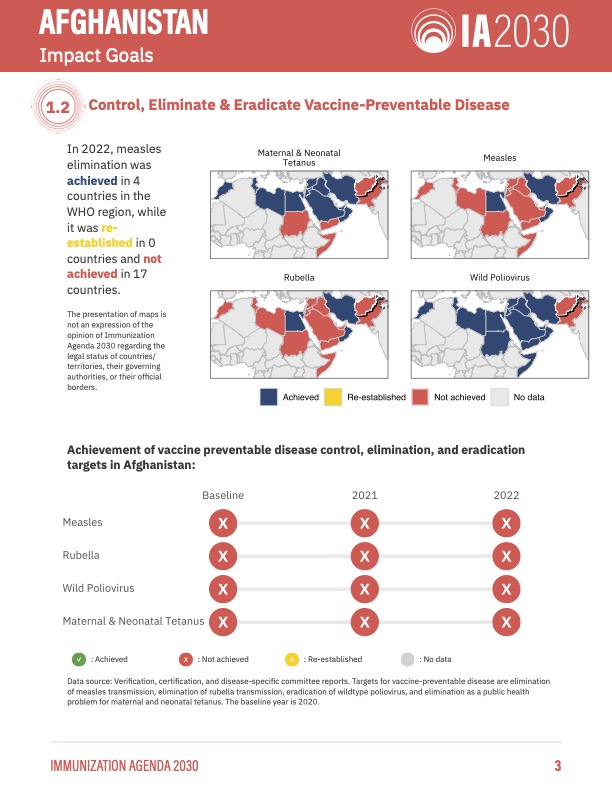
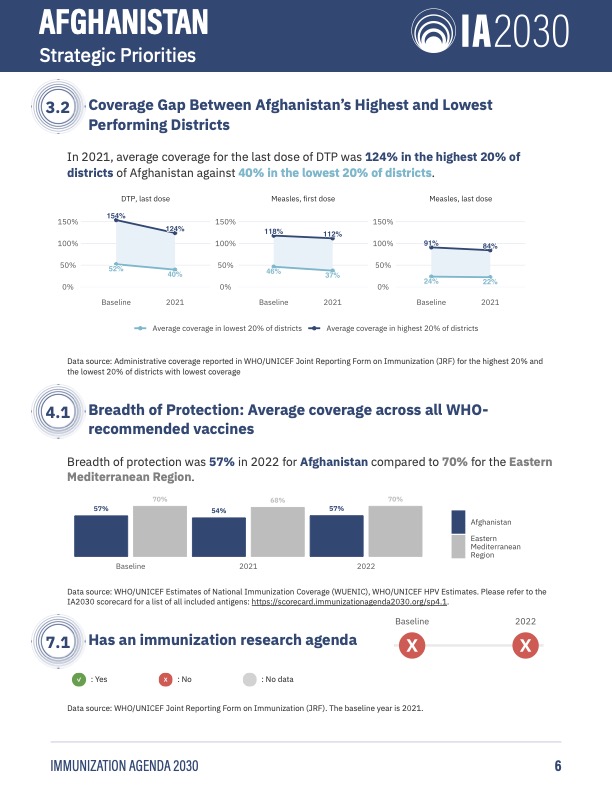
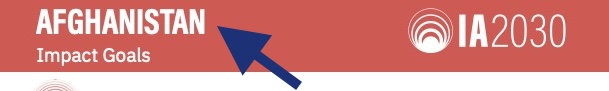
IA2030
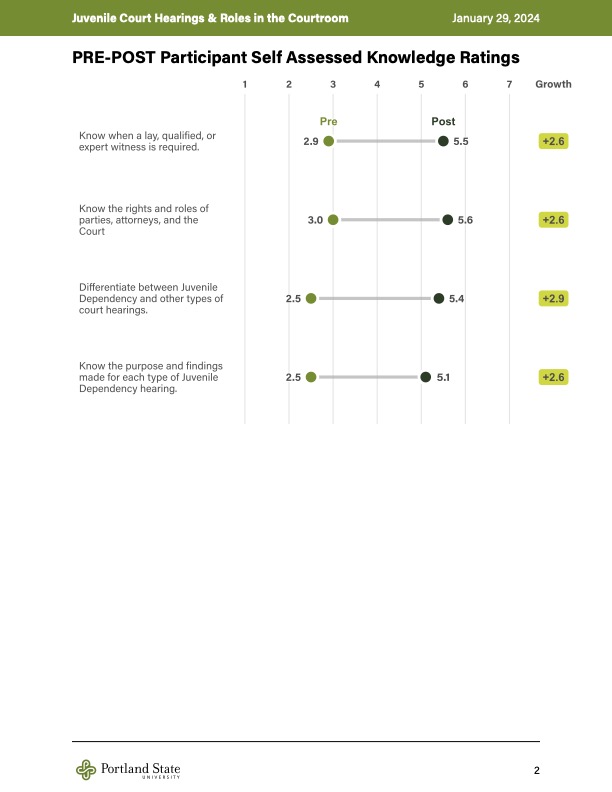
Child Welfare Program
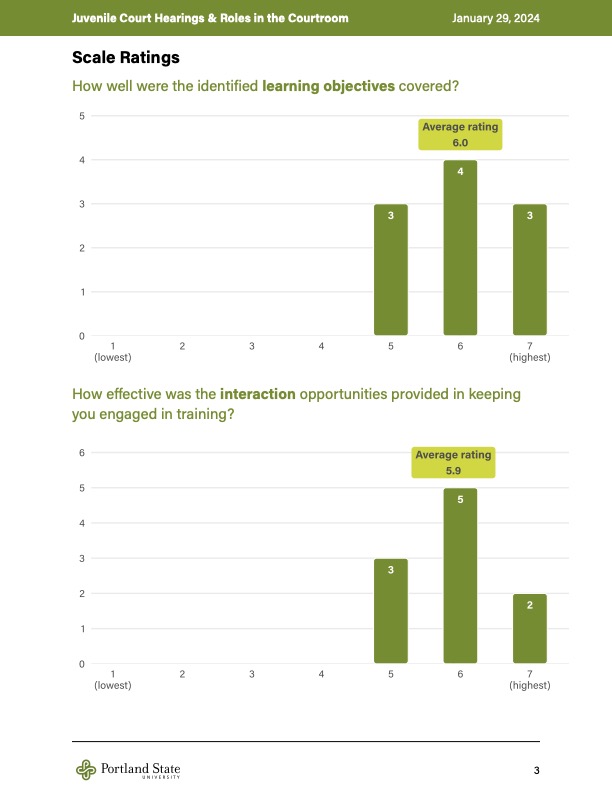
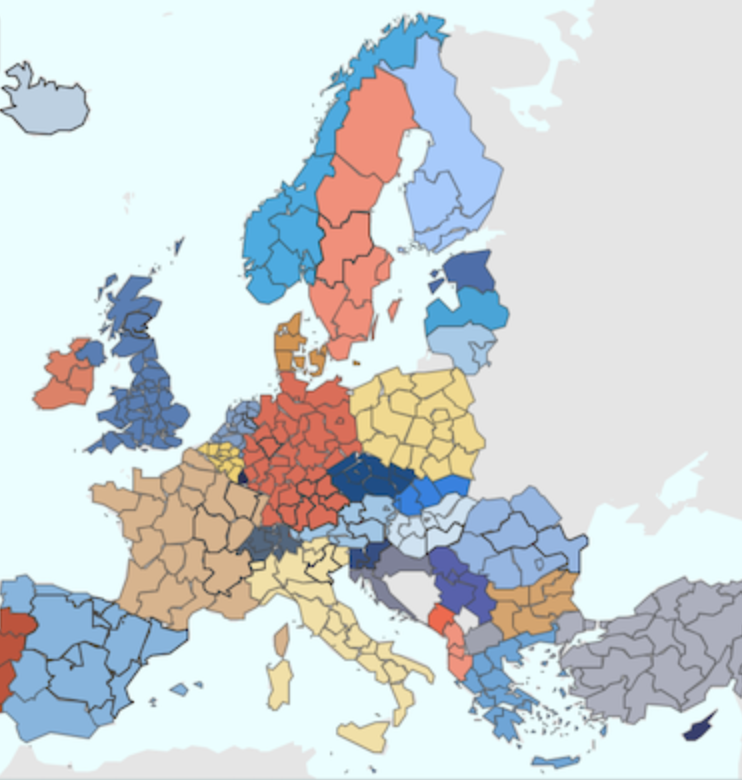
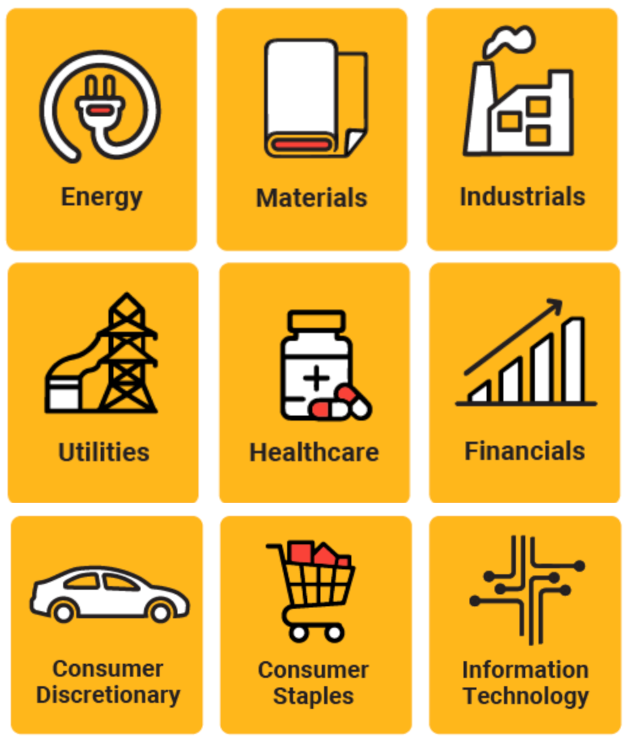
Choose your parameters
Areas
Sectors
Units

Combine them but check you have enough data
Pick up a tool

Text

Computations
![]()
![]()
PDF engines
![]()


Design advices
- Make your parameters explicit
- Think about the extreme cases like long names in margins
Design advices
- Make your sections visuals with named pages & colors

Design advices
- Columns are great but difficult to handle
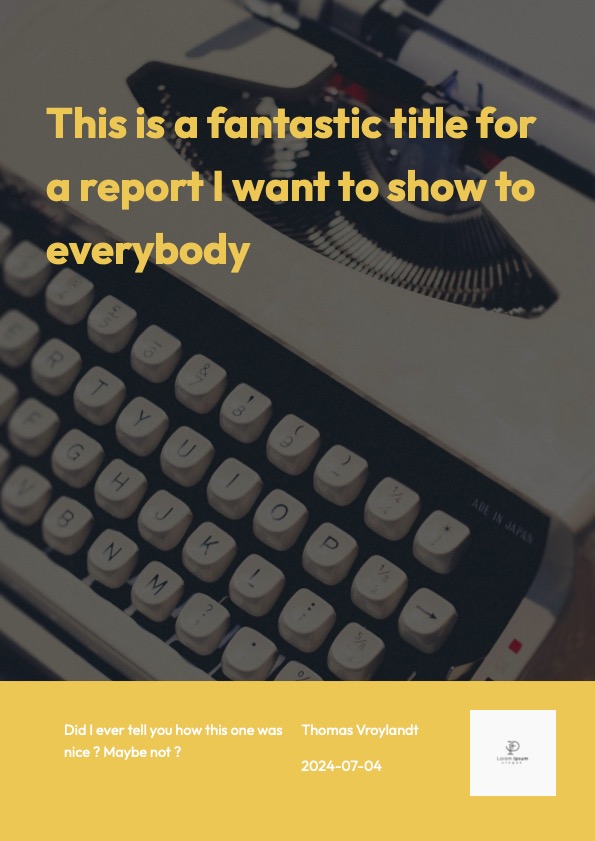
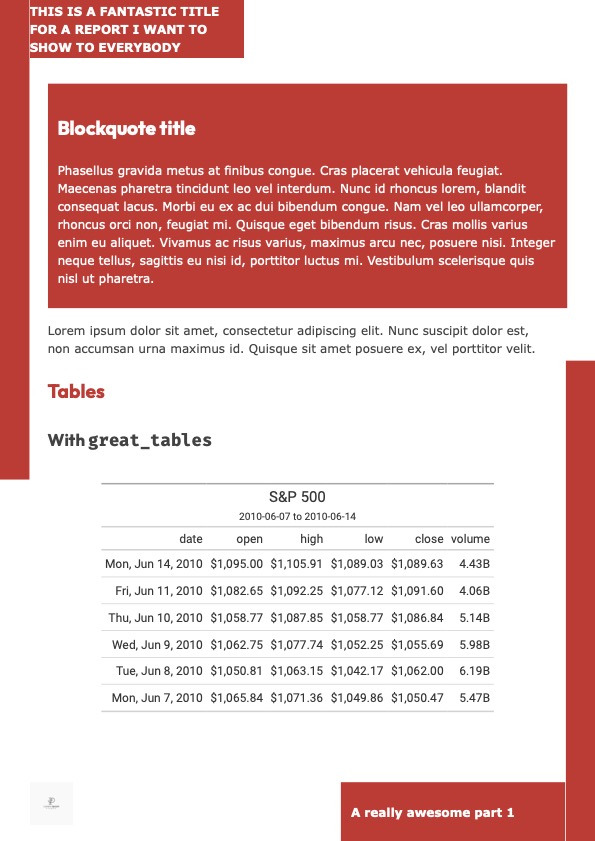
quarto.report - typewriter
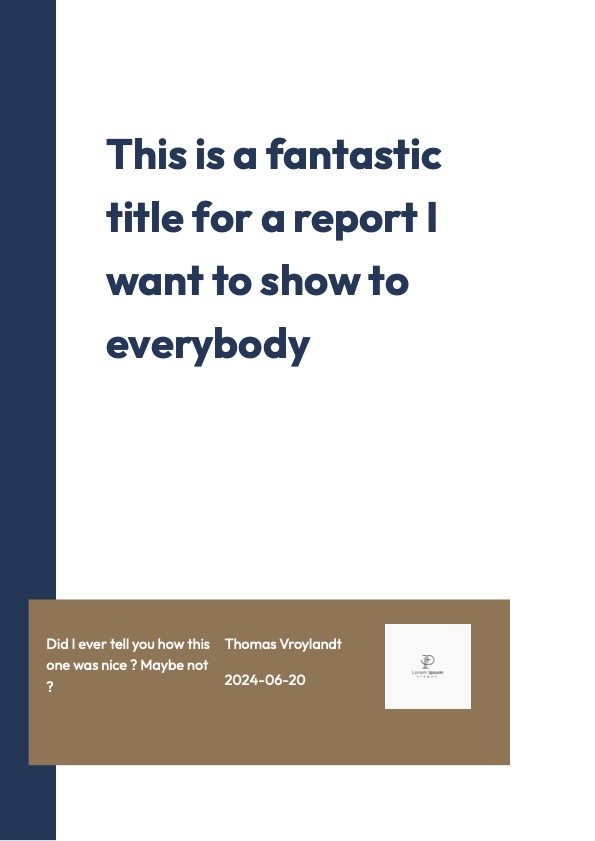
- main image on title page
- table of contents by default
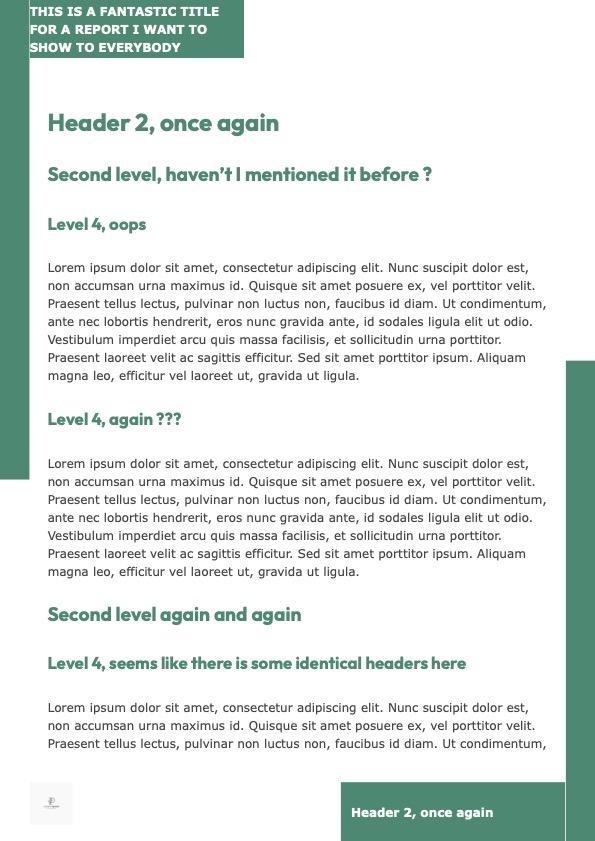
quarto.report - chalk
- two colors template
- table of contents by default
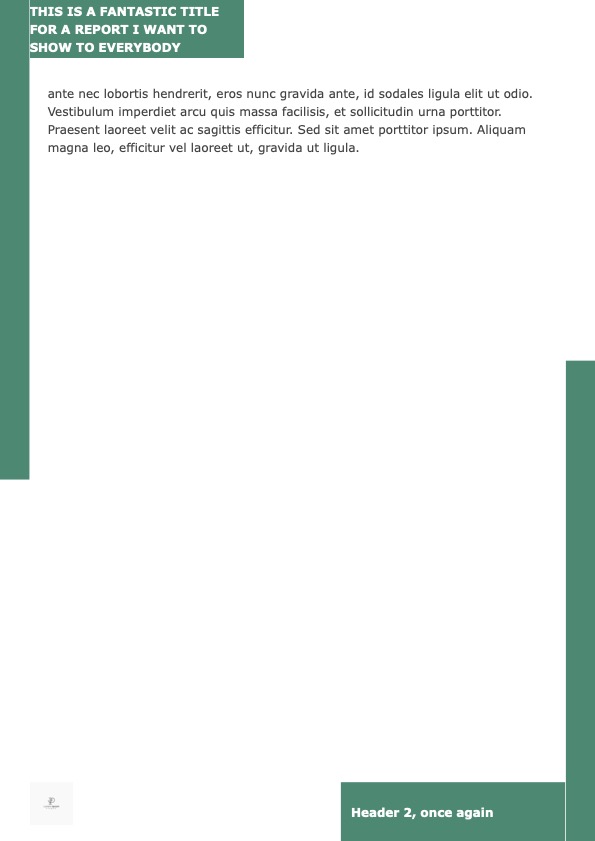
quarto.report - corner
- well suited for parametrised reporting
- one additional named page by default
Check missing data
Compute explicit missing data with tidyr::complete
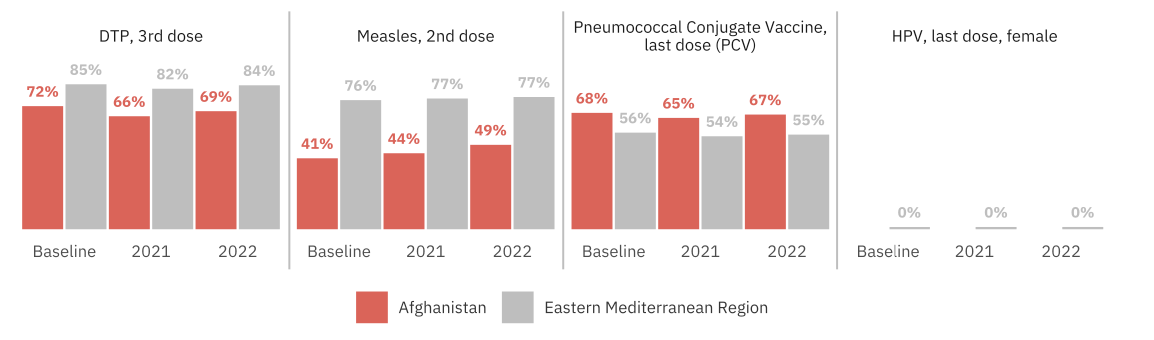
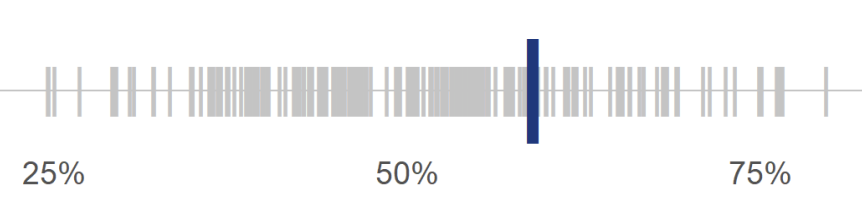
Set up a reference
To the global level

To others
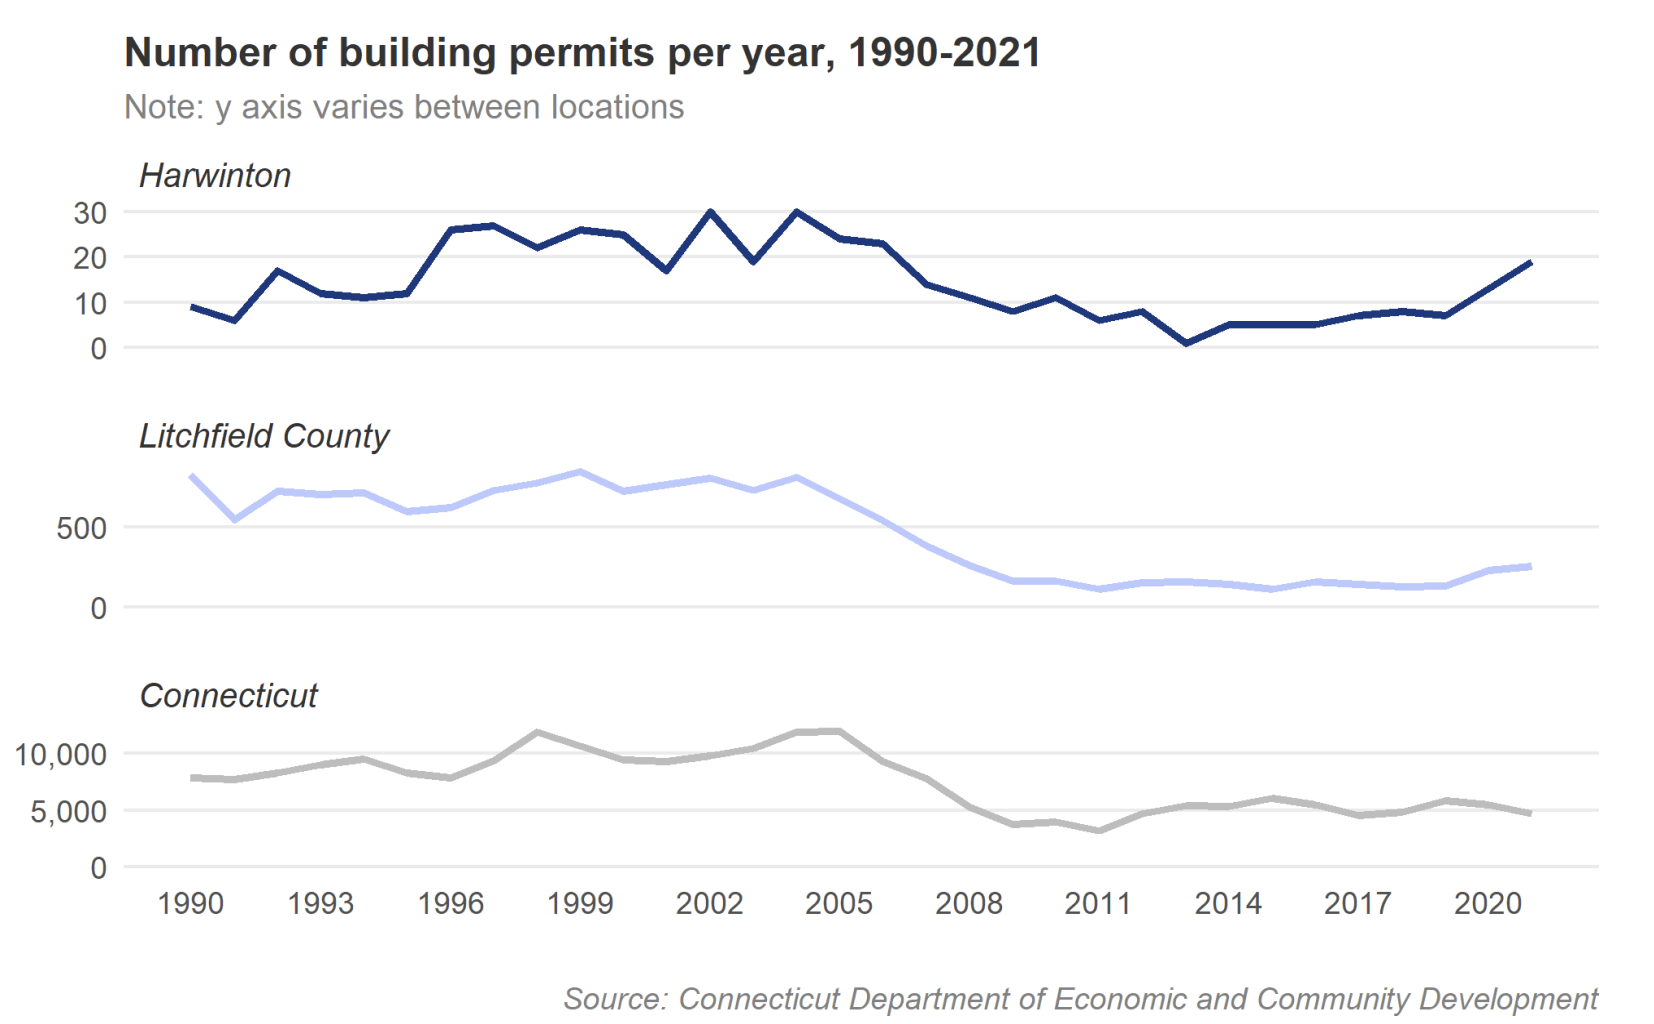
In time

You can pick them all
Set up a reference
Set up a reference
Set up a reference
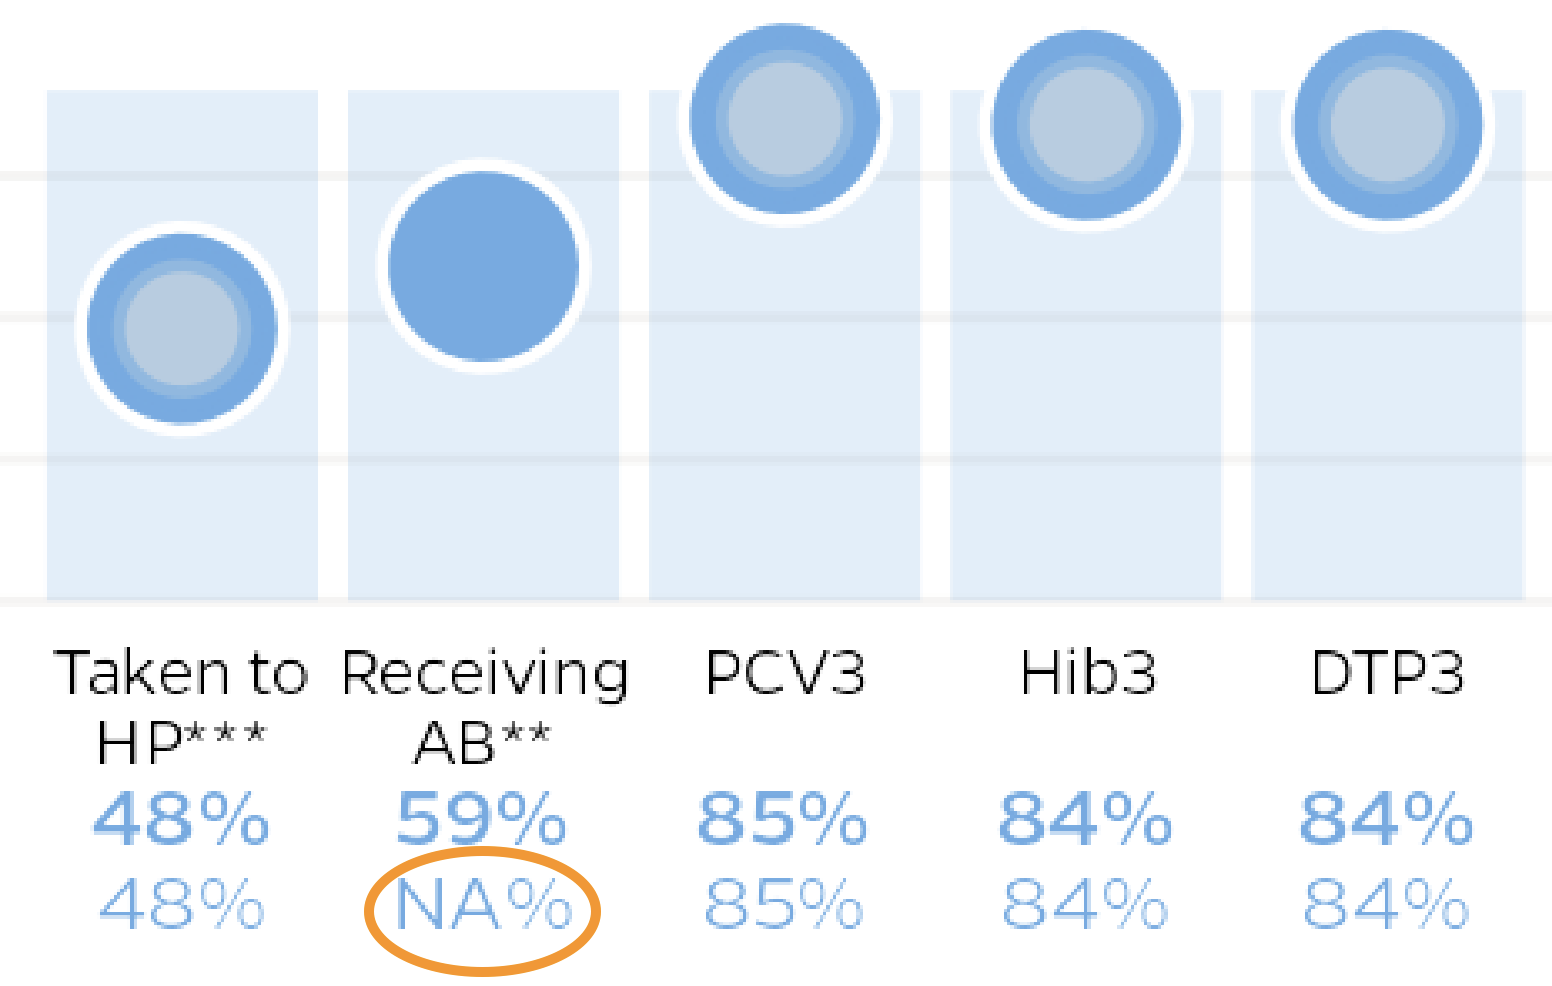
Highlight
Use :
- size
- color
- weight
<span>...</span>